Essay – Structure and Formation of the Milky Way Part One of Three
This is the first article in a three-part series about the current status of research about the structure and formation of the Milky Way. I submitted the essay as part of my Master’s studies in Astronomy at Swinburne University.
- The Structure and Formation of the Milky Way
Archeologists have a distinct advantage over astrophysicists: their objects of analysis are close; they can excavate historic or prehistoric sites, analyze artifacts and radiometrically date them; and read leftover stone scripture from time witnesses. Astrophysicists on a quest to archeologically understand the formation and evolution of the various components of the Milky Way (MW) do not have it that easy. They need to overcome the obstacles of distance to their observation objects, the timescale, and hence the lack of eyewitness observations. Besides, significant information is lost in the formation process through the mixing of stellar objects. However, gradually, with large-scale surveys suck as Gaia, better technology, and improved observations of spatial, kinematic, and chemical properties and theoretical models, they are assembling a clearer picture of the puzzle pieces to achieve a better understanding of the formation and structure of the Milky Way.
A hazy band in the night sky, the Milky Way, a barred spiral galaxy classified as Sbc, starts to resolve into various components with the assistance of telescopes and surveys. The Gaia survey and the recent Data Release 2 (DR2) with parametric information for more than 1.6 billion stars (Gaia Collaboration 2018) have made unprecedented contributions to discern various components of the Milky Way based on cohesive characteristics, including stellar kinematics, metallicity, and age. But even before Gaia, research over the last decade resulted in a more defined structural picture of the MW, as illustrated in the image below and as described in Table 1 of the Appendix.
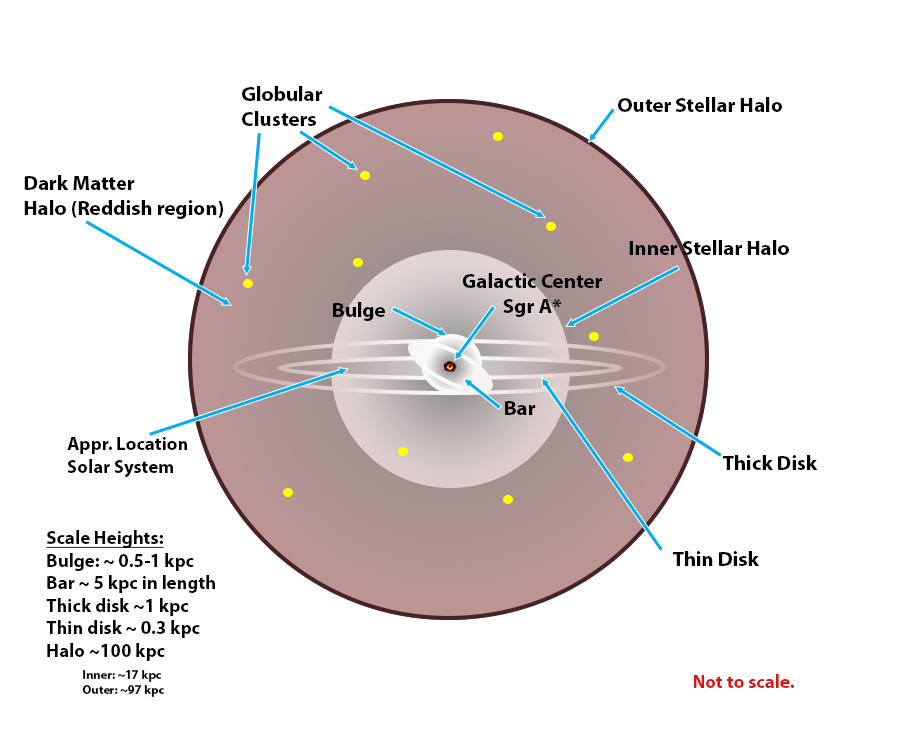
Image 1: The Structural Components of the Milky Way
Assuming a Lambda Cold Dark Matter (LCDM) model and Searly & Zinn (1978), the formation of the Milky Way galaxy follows a bottom-up hierarchical clustering of stellar matter from a dark matter halo, which is roughly 200 kpc in diameter and approximately 1012 M⊙ in mass per Watkins (2019), which agrees in magnitude with Kafle (2014). Luminous matter makes up approximately 9×10¹⁰ M⊙. Age estimates of the oldest star at the Galactic Center (GC) indicate an age of the MW of around 13.5 Ga (Schlaufman et al. 2018), and the oldest Halo stars estimated 12.4 to 13.5 Ga.
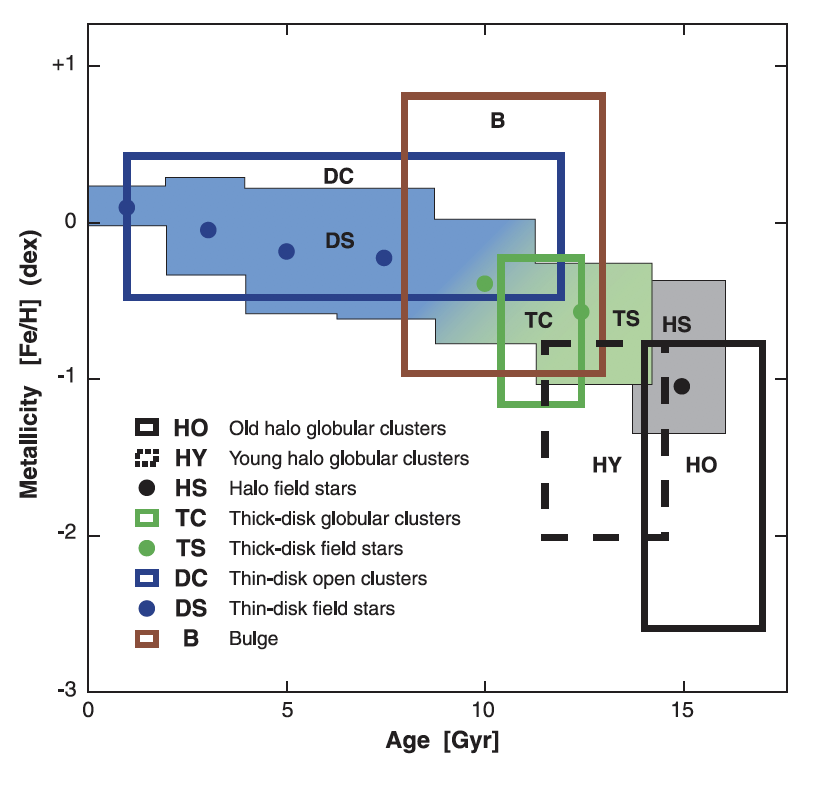
The initial gas clouds containing primordial material, such as hydrogen and helium, formed the first stars of the MW, according to Carollo et al. (2016). Gas clouds with various masses and gas content behaved differently: the smaller clouds formed one or two generations of stars (older objects) and then merged with other clouds and ended in the center of the Galaxy due to gravitational contraction, while more massive mass clouds formed multiple generations of stars in situ (younger objects) before they merged. The existence of the Large and Small Magellanic Clouds, as well as the Sagittarius dwarf galaxy, support a history of hierarchical clustering formation. A recent discovery of a low-luminosity dwarf galaxy, Antlia 2, adds to this observation of accretion and merger of clusters and dwarf galaxies (Torrealba 2018). Last, Buser (2000) notes that the Milky Way continues to interact with large Galactic globular clusters like Messier 54, Terzan 7, Terzan 8, and Arp 2. This relatively well-understood galactic formation process leads to the chronology of the birth of Halo, Galactic Center/Bulge, where the disk formed inside-out from the Thick Disk to the Thin Disk. Buser (2000) analyzed the various metallicity of components, as illustrated in Image 2. The image shows an increase of metallicity [Fe/H] as time progresses as well as spatial agglomeration. However, he notes that there is a dispersion of this age to metallicity relation due to dynamic mixing. The brown box representing the bulge does not account for the observation of the recent Population III stars discovery close to the GC.
Image 2: Metallicity and Age of Milky Way Components
The colored cubic illustration in Image 3 by Carollo (2016) generally agrees with other observations and models for the formation of interconnected structures of the Milky Way.
Image 3: Age Dispersion of the Milky Way
